NOAA Yearly Report
YEARLY CLIMATOLOGICAL SUMMARY FOR 2023
HEAT COOL
MEAN DEG DEG WIND SPEED DOM MEAN MEAN
MON TEMP HIGH DATE LOW DATE DAYS DAYS RAIN AVG HI DATE DIR BAROM HUM
---------------------------------------------------------------------------------------
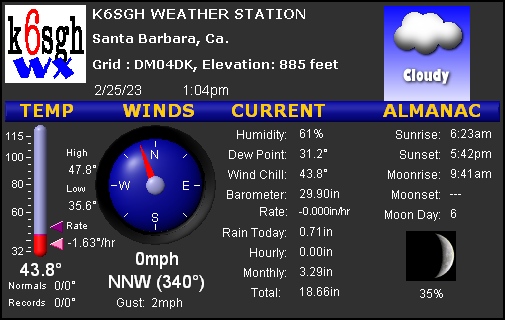
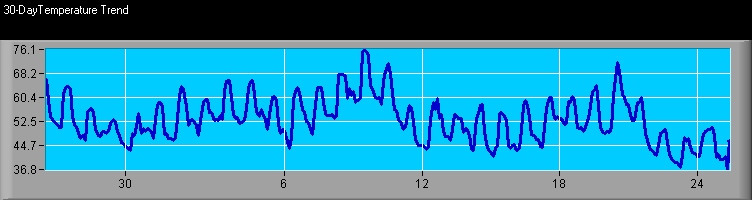
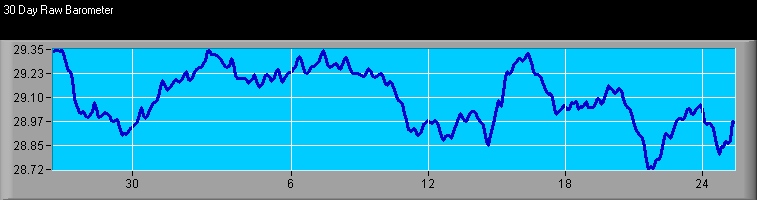
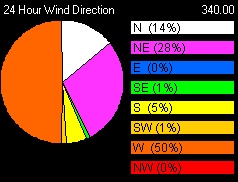
1 53.1 67.4 1/25/23 42.9 1/30/23 86 0 14.70 1 16 1/30/23 S 30.09 53
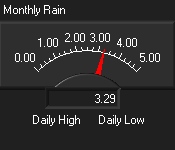
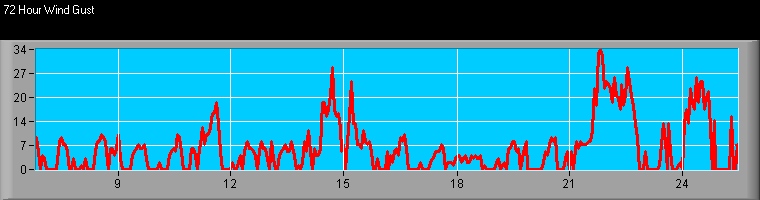
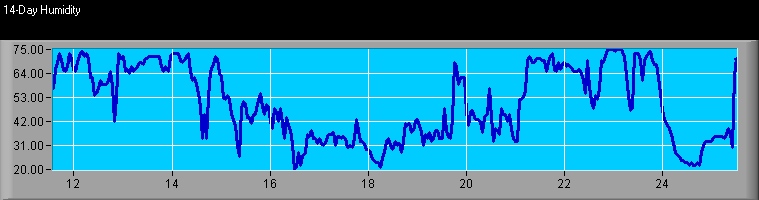
2 53.4 76.9 2/9/23 35.6 2/25/23 293 7 3.29 2 41 2/21/23 SSW 30.05 48
---------------------------------------------------------------------------------------
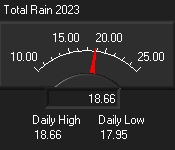
TOT 53.3 76.9 2/9/23 35.6 2/25/23 379 8 18.66 1 41 2/21/23 SSW 30.06 49
HEAT BASE: 65.0
COOL BASE: 65.0
NOAA Monthly Report
MONTHLY CLIMATOLOGICAL SUMMARY FOR 2/2023
HEAT COOL
MEAN DEG DEG WIND SPEED DOM MEAN MEAN
DAY TEMP HIGH TIME LOW TIME DAYS DAYS RAIN AVG HI TIME DIR BAROM HUM
---------------------------------------------------------------------------------------
1 54.0 64.1 12:30pm 46.3 2:30am 11 0 0.00 1 11 3:00pm S 30.16 50
2 54.8 60.6 2:45pm 47.4 7:00am 10 0 0.00 1 9 12:00pm NE 30.27 45
3 57.7 67.8 1:00pm 52.1 11:45pm 7 0 0.00 1 10 12:30pm S 30.20 46
4 57.7 66.2 12:45pm 51.5 6:15am 7 0 0.00 1 8 1:00pm ESE 30.14 57
5 54.2 61.2 12:15pm 48.5 9:15pm 11 0 0.10 4 24 3:15pm SSE 30.17 54
6 54.6 64.0 3:00pm 43.5 4:30am 10 0 0.00 1 17 12:15am WNW 30.22 47
7 56.4 65.2 2:00pm 47.8 6:30am 9 0 0.00 1 12 12:00pm SSE 30.24 41
8 61.7 69.6 9:15am 52.8 5:30am 4 1 0.00 1 14 1:45pm SSE 30.21 36
9 66.0 76.9 12:30pm 57.2 3:00am 3 4 0.00 1 10 12:45am ESE 30.17 33
10 61.9 71.5 12:30pm 53.1 11:45pm 4 1 0.00 1 11 2:45pm E 30.08 41
11 51.0 59.1 12:45pm 44.1 10:00pm 14 0 0.00 2 20 1:15pm SSW 29.88 62
12 51.3 60.2 4:15pm 42.9 6:45am 14 0 0.00 1 11 8:00am ENE 29.88 63
13 50.7 56.3 10:00am 45.2 6:15am 14 0 0.00 1 13 10:45pm SE 29.92 69
14 49.4 59.6 3:00pm 42.2 11:30pm 16 0 0.00 4 29 5:00pm SSW 29.89 62
15 47.5 56.2 1:30pm 41.2 2:45am 18 0 0.00 2 28 5:15am WNW 30.15 46
16 50.2 60.1 11:45am 43.0 3:30am 15 0 0.00 1 11 1:30pm SSW 30.22 35
17 52.4 61.5 2:00pm 43.9 6:15am 13 0 0.00 1 9 3:45pm WNW 30.03 33
18 54.5 61.4 1:45pm 49.5 11:30pm 10 0 0.00 1 5 1:45am E 30.00 31
19 54.9 64.3 2:45pm 47.3 10:30pm 10 0 0.00 1 9 11:15am E 30.03 43
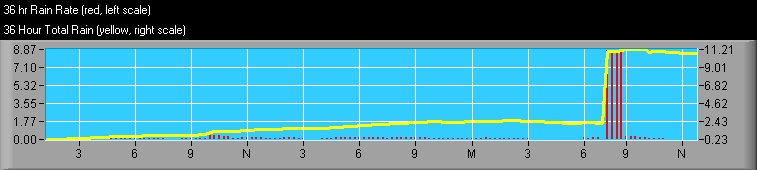
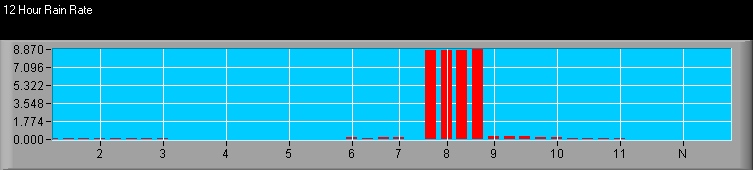
20 59.3 72.2 1:30pm 48.4 12:15am 7 1 0.40 1 11 2:00pm SSW 30.04 42
21 53.7 61.1 2:45pm 42.9 11:30pm 11 0 0.00 4 41 7:15pm SW 29.77 64
22 44.1 50.3 10:45am 38.9 10:45pm 21 0 0.00 7 29 1:45pm WSW 29.82 65
23 42.3 48.1 11:15am 37.5 6:15am 23 0 0.32 0 14 11:15am SSW 29.97 67
24 46.2 50.9 5:45pm 40.6 8:45pm 19 0 0.02 4 27 5:15pm NE 29.85 29
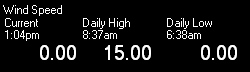
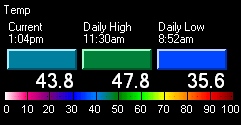
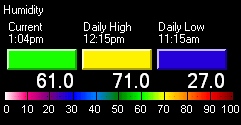
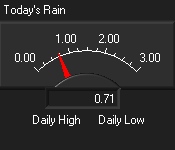
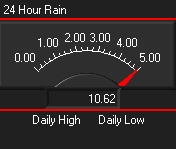
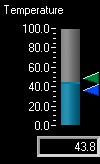
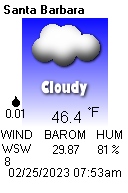
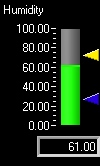
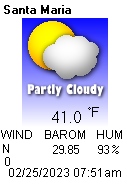
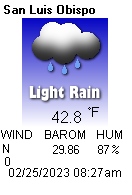
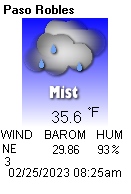
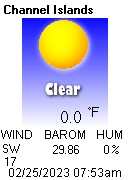
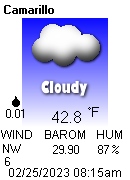
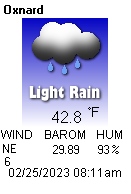
25 41.5 47.8 11:30am 35.6 8:52am 11 0 0.71 0 15 8:37am E 29.85 38
---------------------------------------------------------------------------------------
TOT 53.4 76.9 2/9/23 35.6 2/25/23 292 7 3.29 2 41 2/21/23 SSW 30.05 48
HEAT BASE: 65.0
COOL BASE: 65.0
|